Every action leaves a trace
Sales, marketing campaigns, inventories, suppliers, foot traffic, opening hours, or any other activity generates data that, when interpreted, contributes to a broader and deeper understanding of the organization and the commercial context in which it operates.
A data point is an objective representation of a fact, an action, or a condition and, by itself, is without value; it acquires value when interpreted within a context, and importance when linked to a decision or an action.
Contextualizing data means correlating it to other data and to the surrounding environment, situation, or the moment in which it occurred.
The interpretation of contextualized data generates useful information for understanding the business reality.
Ask questions to understand
The advanced and systematic level of the process that transforms data into information is called Business Intelligence (BI).
BI is a set of processes and tools for gathering and analyzing data from multiple internal and external company sources, in alignment with its unique characteristics.
The goal of BI is to provide the information necessary to make informed and fact-based decisions.
Therefore, the first step to implementing BI in your business strategy is to define a specific question, or a hypothesis, about your activity.
Interact with dynamic reports
BI provides access to custom reports and dashboards, simplifying the process of finding answers.
The reading of personalized reports is quick and intuitive; the ability to activate filters for selections or comparisons allows for a more in-depth analysis.
Data is presented clearly and effectively, ready to be transformed into actionable insights.
BI scales with your needs, enabling reports to adapt to new questions or hypotheses.
From data to answers
To experience the potential of BI, we invite you to explore
this dashboard simulating the operations of a bookstore using realistic, fictional data. Interact with the filters to segment indicators and transform data into information.
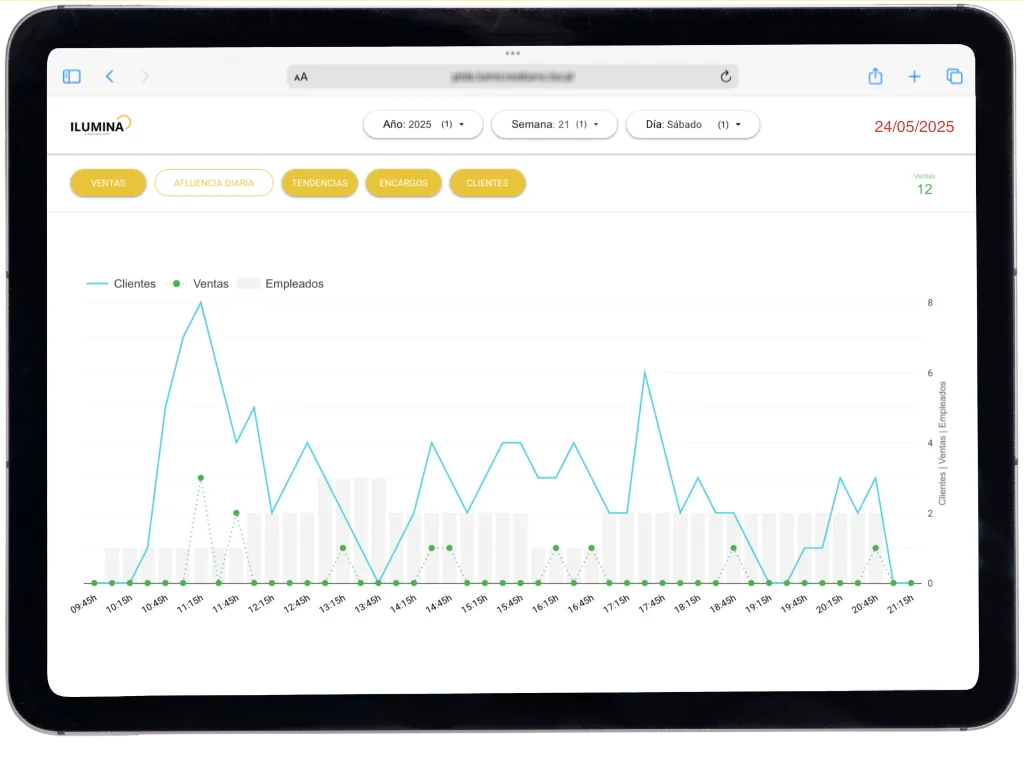
 Business Intelligence dashboard